

TL;DR
Team: Me as a lead, front-end engineer, backend engineer, systems analyst
Timeline: Core built in 2 weeks
Context: Foliage / Pregel Pro — AI-native digital twin platform for IT infrastructure
Pregel Pro’s existing front end took 30-40 minutes to build a single infrastructure model, because every screen for every hardware and software system (HSS) had to be hand-programmed. I put together a three-person team and set out to prove a different approach was possible: intake an already-existing data model and visualize it instantly, with no pre-built screens at all. We called the result Flora. In two weeks, the core could render a full model in seconds. The team’s reaction: we’d matched, in two weeks, something Pregel Pro had spent four years building.
The Problem
Pregel Pro visualizes complex IT infrastructure as a digital twin, letting operators see and reason about their systems as a model rather than a pile of logs and dashboards. The idea was strong. The execution was the bottleneck.
The front end relied heavily on hand-built DOM elements. Every screen, for every hardware and software system in a customer’s infrastructure, had to be pre-programmed individually. There was no generic way to say “here’s a new type of system, show it.” Someone (both the back end and the front end engineers) had to build that screen first. It was a graph interface, but it wasn't even put on a zoomable canvas.

That constraint showed up everywhere, but most painfully at initial load: building a data model from scratch took 30-40 minutes, driven by backend processing that a rigid, hand-coded front end had no way to shortcut or work around. For an operator trying to get visibility into their infrastructure, that’s not a loading spinner, that’s a coffee break, a context switch, a reason to give up and go back to the old tools.
The Bet
The hypothesis: what if the front end never needed to know about a specific HSS in advance? What if it could take an already-existing, pre-made data model of the infrastructure and render it on the fly, instantly, regardless of what was in it?

If that worked, two things would fall out of it for free: the 30-40 minute wait would disappear, and the team would stop hand-coding a screen for every new system type. The model itself would carry the information needed to visualize it.
I pulled together a small team, front-end engineer, backend engineer, systems analyst, and set a tight scope: prove the core in two weeks. Not a polished product. A working demonstration that instant, generic visualization was possible at all.
I named the project Flora as an homage to its core library Foliage.
The Product Direction
Proving the core fast also meant deciding, quickly, what the right shape of this new front end was. A few decisions anchored everything else.
A flexible home screen, not a fixed one. Instead of a rigid dashboard, the home screen is built from resizable widgets. Each widget can hold a different kind of content: a graph (the data-model visualization itself), a table, code, or a chart-style graph. The goal was to give an operator an adaptable workspace they could reshape around whatever an incident actually demanded, rather than forcing them through a fixed set of pre-built screens.

Full-screen on demand. Click a widget, and it expands to full-screen with all of its functionality available. Operators get the flexibility of a dense, multi-widget overview *and* the depth of a focused, single-purpose view, without needing two separate tools.

The graph widget does the real work. This is where the core bet lives. Instead of a hand-programmed visualization per system type, the graph widget can render whatever’s inside the model, generically. New HSS types don’t require new screens. They just render.
Shareable, permissioned workspaces. Multiple dashboards, shareable by link, with read/write permissions per user, closer to how Figma handles files than how a typical enterprise dashboard tool does. An incident isn’t a solo activity; the tool needed to support people looking at the same model together without stepping on each other.
The Trade-off That Mattered Most
The biggest technical decision was the rendering approach for the graph itself, and it wasn’t free.
A pure hand-built DOM structure is maximally flexible: you can visualize any data type any way you want, because you’re writing it by hand every time. That flexibility was exactly what had made Pregel Pro’s old front end so slow to build and so hard to scale.
We chose ReactFlow instead. It’s less flexible than hand-rolled DOM, some collapsible-element behavior we wanted had to be scoped down to fit what the library offered. But it bought us a canvas, a ready-made component model, and real development speed. It also turned out to perform: the graph widget could render over 1,000 objects on screen, with throttling only kicking in past roughly 800 objects, which was more than enough headroom for real infrastructure models.
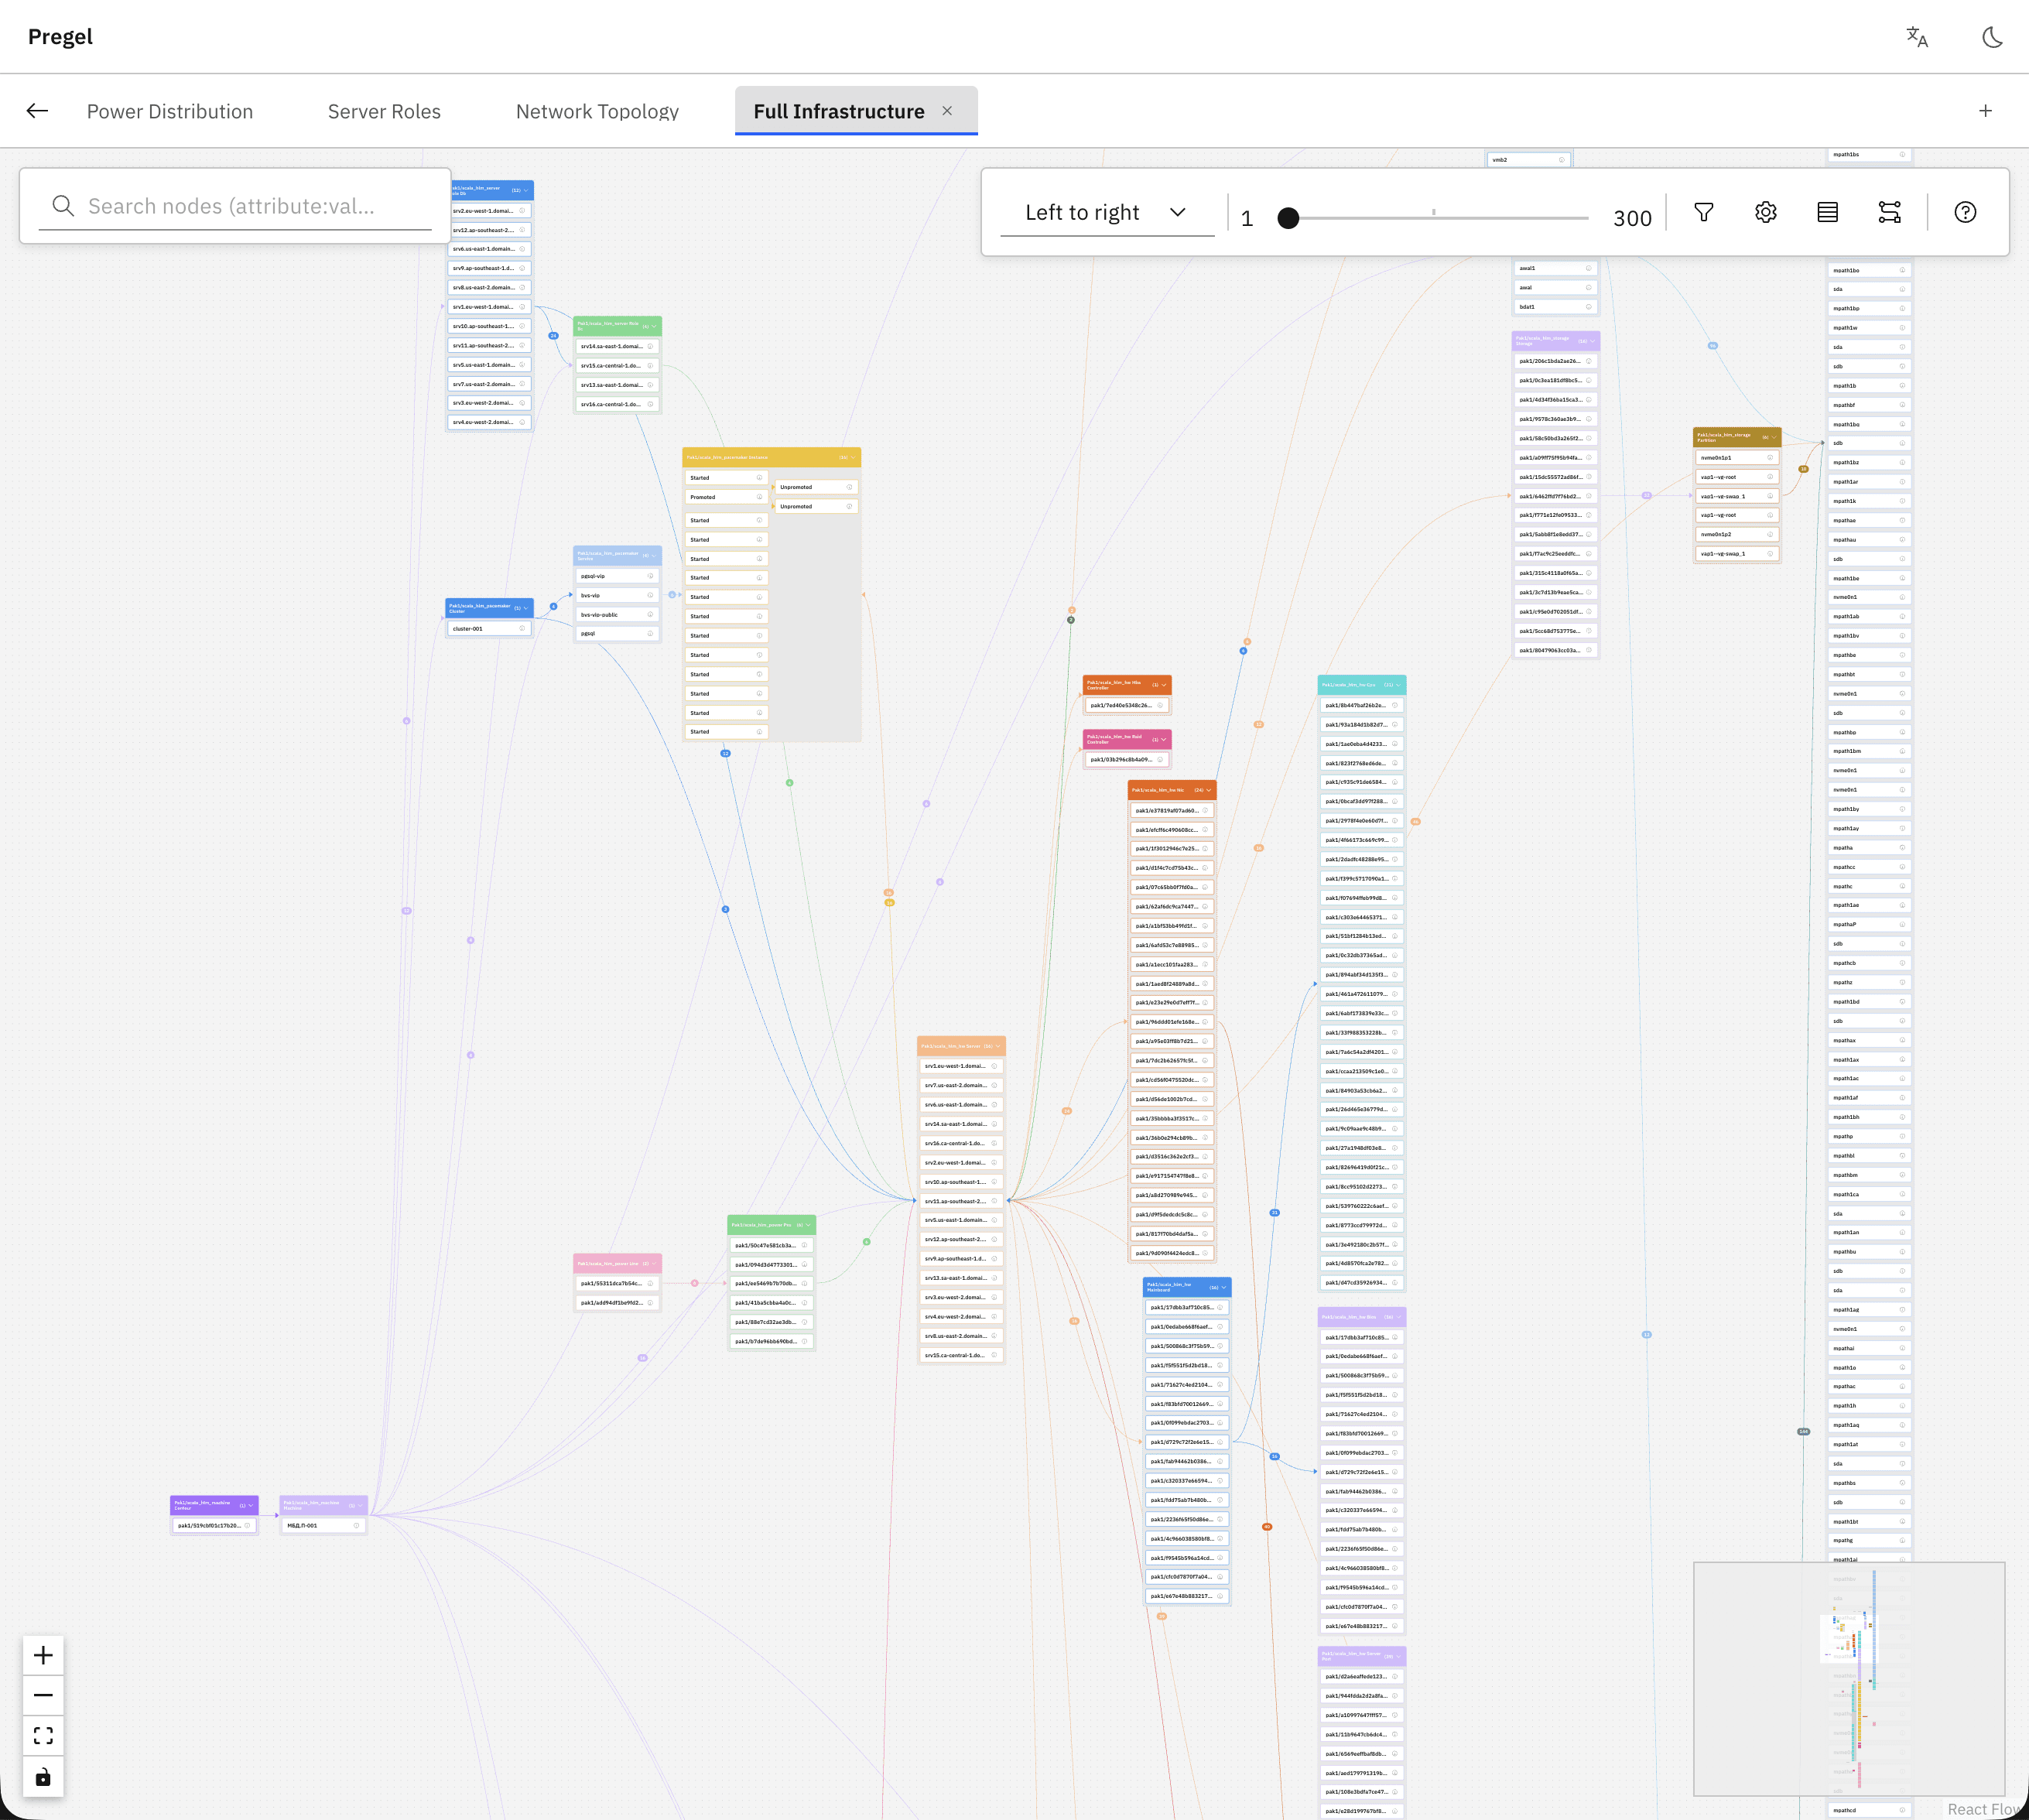
That trade held up. We gave up some raw flexibility and got back an engineering pace and a rendering ceiling that made the two-week core deadline realistic instead of aspirational.
What Shipped in Two Weeks
By the end of the sprint, Flora’s core could take an already-existing infrastructure data model and visualize it in seconds. No pre-build. No 30-40 minute wait. No hand-coded screen per HSS.
We didn’t have hard adoption metrics at this stage, this was a proof of the core, not a shipped product with a user base to measure. What we had instead was the reaction from the team and stakeholders who’d been living with the old front end: a kind of quiet disbelief that a three-person team, in two weeks, had built something that competed with a product Pregel Pro had spent four years developing.
That reaction is the real signal. It wasn’t “this is a nice prototype.” It was “this changes what we thought was necessary to build this at all.”
Reflection
Flora’s core insight wasn’t really about ReactFlow, or widgets, or any single technical choice. It was about refusing the premise that visualization had to be hand-built per system. Once the model could describe itself, the front end’s job changed completely, from “build a screen for this” to “render whatever’s here.”
The trade-offs were real. We gave up some flexibility for speed, and the widget-based home screen means less pixel-perfect authorship over each configuration. But those trade-offs bought back the thing that actually mattered: an operator making decisions during an incident doesn’t have time for a coffee-break loading screen, and a team building this product doesn’t have four years to spend proving it’s possible.
---
Figma file (sketches)